An interesting graphic from Bank of
Italy’s FinancialStability Review just released. The
graphic details collateral pledged to the Bank of Italy (“the Bank”) against
loans it has credited to counterparties in Eurosystem credit operations.
In part (a) “amounts” of the graphic we see levels of
overcollateralization at the Bank of Italy among its various counterparties in March 2012 and
August 2011. The blue is the amount
actually credit by the Bank to counterparties, the yellow is the value of
credit available to counterparties based on existed collateral posted (level of
overcollateralization) and the red is the Bank’s estimates of the net value of
unencumbered assets that are owned by counterparties and not pledged as
collateral to the Bank or elsewhere. All
of the amounts (in billions of euros) represent values net of haircuts, in
other words they do not represent the market value of the collateral but rather the value of credit available in Eurosystem repo operations based on the outstanding collateral.
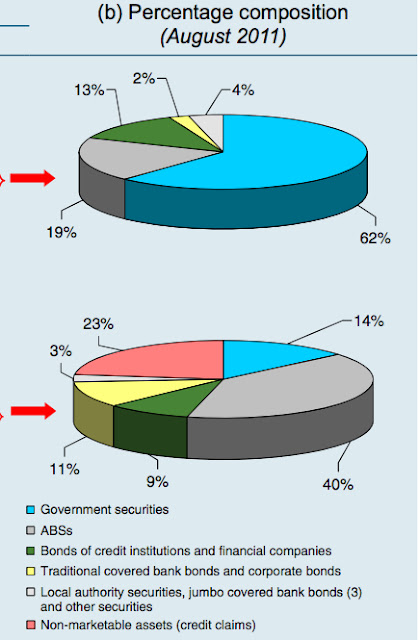
Part (b) details the composition of the collateral posted
with the Bank. The bottom pie represents
the share of the collateral actually posted with the Bank and the top pie
represents the share of unpledged collateral.
Some observations:
- The total amount of collateral posted to the Bank and freely
available grew dramatically from August to March, from 207 to 474 billion. Some reasons for this include an increase in
the available collateral due to ECB policy changes (extension of credit claim
collateral and lower ABS ratings permitted), and Italian government guarantees
for certain new bank issues. Other
possibilities include an increase in the total amount of securities available
(e.g. net issuance by Italian sovereign/banks) and a decrease in repo with
private counterparties freeing up more collateral.
- The amount of overcollateralization decreased from 48% in
August to 33% in March. Yet the fact
that Italian counterparties are still overcollateralized by 91 billion euros
with an additional 111 billion estimated by the Bank to be available based on outstanding collateral suggests the overall liquidity position of the Italian banking system
is not in acute crisis.
- Of
note, the large majority of the extra collateral resides with Italy’s biggest
banks (“5 main counterparties”) who collectively hold 67% of excess while only
representing 40% of borrowing.
- It
appears that the Bank has been successful in getting liquidity to smaller banks
as the amount of credit extended to “other Italian counterparties” increased
dramatically, from 28 billion in August to 123 billion in March.
- In terms of the composition of collateral,
the difference between collateral posted with the Bank and collateral freely
available is quite stark. While the vast
majority of eligible assets freely available (88%) are government securities,
the makeup of the pool of assets is a mixed bag.